Discussion:WUFI-Pro PerformanceandLimitations
WUFI's Performance and Limitations
WUFI is a computer program for the calculation of the simultaneous heat and moisture transport in multi-layer building components. It has repeatedly been validated by comparison with experimental results (see example).
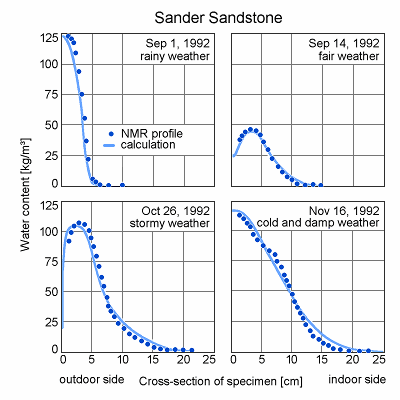
For the test example shown in the diagrams, dry prismatic natural sandstone specimens (5 x 5 x 25 cm³) were incorporated into the west-facing facade of a test hall. The moisture profiles in the prisms were regularly determined by NMR measurements (dots).
The calculations (solid lines) were done using the material data of the sandstone as determined in the laboratory and hourly mean values of the weather data measured during the test period.
The diagrams show the measured and calculated moisture profiles for four typical
weather conditions:
- after a period of rain (sharply defined moisture front like in an imbibition experiment),
- after a longer period of fair weather (moisture front has been flattened by drying and redistribution),
- in stormy weather with low exterior humidity ("foehn" weather; steep moisture gradient close to the surface, resulting from high drying rate),
- during cold and damp weather (steady gradient of moisture content - nearly free saturation at the exterior surface, still dry close to the interior surface).
Nevertheless, WUFI also has its limitations. As with every tool, you should be aware of what WUFI can do and what it can not.
The fact that WUFI's results have been calculated by a computer does not make them infallible. You should check every result for plausibility. There are numerous circumstances that can degrade the quality of a calculation or even render it worthless (a slightly inaccurate result may be more dangerous than a totally wrong one since it may not be easily recognized as such). Some possible problems are
- program errors
- input errors
- insufficient knowledge of the required data
- limitations of the underlying mathematical model
- numerical problems.
These items will be discussed in the following.
Program Errors
WUFI has been tested comprehensively and should not contain any errors that might affect the calculation results. Considering its complexity, it can not be ruled out, however, that problems might arise under certain circumstances. Please report any problems to IBP.
Input Errors
Having entered all data, save them to a project file in order to have a status quo and recheck the entries in all the dialogs in the sequence of the menus to make sure they are correct. Display overviews of the material data, the object assembly and the other input with the dialog "Input Data Summary" (in the menu "Outputs").
Refer to the detailed explanations provided in the
on-line help to make sure that WUFI's
interpretation of the material data, surface transfer coefficients etc.
is the same as yours.
Note there are possible side effects if you are
generating tables from standard data.
Insufficient Knowledge of the Required Data
It often happens that material data, coefficients or boundary conditions required for the calculation are not well known. Do not try under these circumstances to obtain a 'precise' result.
Instead, estimate the possible variation range of the input data and perform some representative calculations for this range. From the variation in the results you may see if those aspects of the results which you are interested in are affected by the uncertainty or not. In the latter case, they may be usable nevertheless; in the former case, a more precise determination of some input data may be necessary.
Actually, in cases where you have 'reliable' data at your disposal, you should bear in mind that in practice there are also variations in the materials or workmanship which might cause deviations from your theoretical results.
It can be more instructive to know the effect of the variations of an estimated parameter on the results than to use 'precise' input to arrive at a single numerical result of unknown reliability.
Limitations of the Mathematical Model
The complex hygrothermal processes in a building component need to be simplified to make their simulation accessible to present-day computers. WUFI has been designed for the most important applications in building physics [1], but several limitations had to be accepted.
WUFI only deals with one-dimensional processes. Situations that cannot be adequately reduced to one dimension (e.g. geometrical thermal bridges, rising damp etc.) cannot be treated by WUFI and must be left to the two-dimensional version WUFI 2D.
Several transport phenomena have been neglected (cf. "What is WUFI?"), that is why e.g. air flows in the component, uptake of ground water under hydrostatic pressure etc. cannot be calculated.
The interdependence of salt and water transport has not been allowed for.
The interface between two capillary-active materials (e.g. rendering/brick) is treated as ideally conducting, whereas in reality there often is a transfer resistance which may reduce the moisture transport considerably. This resistance may be simulated by introducing an interface layer (ca. 1 mm thick) with adequately adjusted liquid transport coefficients [2].
Some materials do not conform to the simplified transport equations. Wood and concrete are changing their material data dependent on their present and past moisture content - the imbibed amount of water does not increase as the square root of time. The consequences of this fact may be negligible or serious - depending on the component assembly and the boundary conditions. Here only a comparison with samples exposed to natural weather can show whether the calculation results are reliable or not. The material data should be determined under boundary conditions similar to practical use.
If a material has a pronounced hysteresis in its moisture storage function, it may not be sufficient to use an averaged moisture storage function for the calculation.
The enthalpy flows resulting from the transport of liquid water across a temperature differential are ignored; i.e., cold rain water does not cool the surface of a building component in the calculation. The cooling effect by the subsequent evaporation of the imbibed water - which is considerably greater in general - is correctly included, however.
For simplicity, the heat transfer coefficients are treated as constant or exhibiting a simple predefined dependence on wind speed. Regarding the simplified longwave radiation exchange with the surroundings, see Reference: Long-wave Radiation Exchange.
In the dissertation [1], on which WUFI is based, you can find an extensive discussion of the mathematical model.
Numerical Problems
If boundary conditions relevant to building physics are to be applied, the coupled differential equations describing heat and moisture transport can only be solved numerically.
Ideally, only the programmers and the computer should worry about the details of the numerical method. Unfortunately, present numerical methods are not advanced enough as to be able to automatically and perfectly adapt themselves to every problem. So it's up to you, the user, to do part of the work that ideally should be done by the computer itself: you have to define a numerical grid and to choose a suitable time step.
How to choose a suitable numerical grid
For a numerical treatment, the differential equations have to be discretised, i.e. the continuous heat and moisture fields decribed by the equations are evaluated at a number of separate points only. To this end, a suitable method is used to reduce the differential equations to a system of algebraic equations which describes the interdependence of those points and which can be treated numerically.
WUFI uses the method of 'finite volumes'. This method first formulates the differential equations in terms of balance equations for heat and moisture and then derives the algebraic equations in a way which makes sure that the heat and moisture balances remain preserved for every element of the numerical grid. That is, the variation of a physical quantity in each grid element is strictly consistent with the amount of that quantity that flows into or out of the element through the element boundaries ("conservative discretisation").
Since the balances are preserved in every individual grid element, they are also preserved in the whole assembly as the sum of all grid elements. This is valid for all possible grids - not only in the limit of an infinite number of grid elements.
Through this mathematical procedure, WUFI has a physical principle (conservation of energy and mass) built right into its heart and thus shows a very robust behaviour regarding the choice of the grid.
This compliance with a basic physical principle means that even coarse, wide-meshed grids can be expected to give physically realistic results.
However...
Instead of the continuous heat and moisture fields, WUFI only knows their values at
separate points. The farther these points are spread, the less the complete fields can
be derived from them. And the less well a field is known, the less precise are predictions
of its behaviour in the next time step.
Furthermore...
Another problem is that two transport equations have to be solved: for heat and moisture.
They can only be solved one after the other, although in reality they are continuously
affecting each other (e.g., a condensation process is a vapour sink and a water source
as well as a heat source; the heat conductivity may be moisture-dependent etc.).
Therefore, a solution step for the temperature cannot allow for the change in moisture content which in reality happens during the same time step. The result for the temperature is thus not entirely accurate. The following solution step for the moisture has the same problem.
Repeating the solution step for the temperature, now taking the new moisture field as a basis (which is slightly inaccurate but certainly better than the original unevolved moisture field) results in a better accuracy of the resulting temperature field. Continued alternating repetitions of these steps (iteration) finally result in temperature and moisture fields that sufficiently approach the desired solutions of the transport equations (convergence).
Under certain circumstances, however, this convergence may be so slow that WUFI has to stop the iteration (cf. convergence failure). Then the heat and moisture fields attained so far do individually satisfy their respective balance equation, but their interdependence has not yet fully developed.
In nearly all those cases, the remaining error is negligible in the context of building physics. If the grid is not well adapted, it may happen, however, that a poor representation of the temperature field cannot adjust itself the way the poorly represented moisture field requires it - the convergence may then be seriously hampered or even impossible. In this case, markedly inaccurate fields may be left after the stop of the iteration. Occasionally, fluctuations in the numerical values may even overload the numerics and produce results that do not conform to the balance equations.
Such a case is very rare, but you should recognise it if it happens. For this purpose, WUFI displays a water balance after the calculation has finished; if you are viewing the film, you can also see 'flutter' appearing in the curves for no apparent reason. As discussed above, you should then first check if the choice of the grid could be responsible for the problems and adapt it accordingly. If that fails, you may try stricter numerical parameters (convergence failures are also discussed in the "Questions and Answers" section).
Unfortunately, there are presently no common methods which can reliably recognise that kind of problem during the calculation and adapt the grid on the fly - you have to remedy this shortcoming by using your own insight into the problem at issue and define the grid yourself. There are no fixed recipes for this, but a few general rules:
For the discretisation, the values of the calculated quantities are assumed to be
spatially constant across each grid element. Therefore, the size of each element should
be chosen so as to make this assumption valid according to the local conditions. In
general, this requires the use of small elements in regions where steep moisture or
temperature gradients are to be expected, and the use of larger elements in more
placid regions to cut down on calculation effort.
In case of doubt, you should prefer a larger number of smaller elements to a few large
ones as long as you can tolerate the computing time.
In general, steep gradients are to be expected close to the boundaries of a layer, i.e., close to the exterior and interior surfaces of the building component because of the influence of climate conditions, and close to internal layer interfaces because of interstitial condensation. Less variation will occur in the middle of a layer.
Splitting up a layer into two layers with identical material data but different expansion factors (>1, <1) allows you to achieve a smooth, not necessarily symmetrical, expansion and contraction of the grid elements which can be adapted to the requirements of each individual layer.
For numerical reasons, neighbouring elements should not differ too much in size. This requires in particular that boundary elements of neighbouring layers be matched, at least approximately.
View a film of the calculation and see if there are noticeable kinks in the curve. Refine the grid in those spots.
To be sure that a suitable grid was chosen for the calculation, you may repeat the same calculation with double the number of grid elements. If the result remains the same, the first grid already was well adapted.
Example 1:
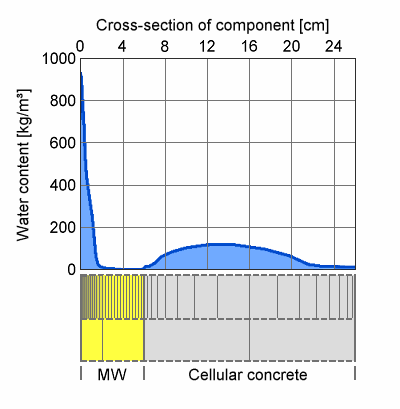
An impressive example of what kind of gradients may occur close to layer boundaries can be seen in the case of construction moisture drying out of a cellular concrete flat roof with mineral wool insulation. During the cold season, the moisture migrates up through the permeable mineral wool and condenses at the impermeable roof membrane in amounts that are not only a problem for the insulation quality but for the numerics as well. In such a case it is imperative to have very fine grid elements close to the roof membrane, while a relatively coarse grid is sufficient in the cellular concrete.
Example 2:
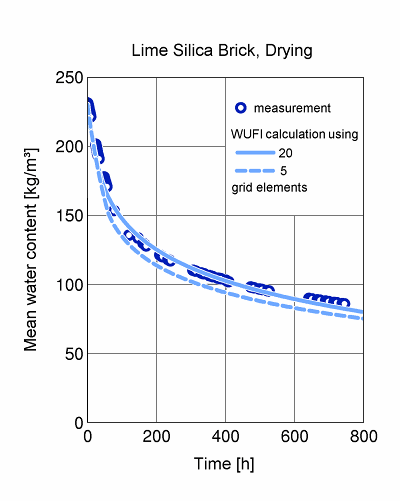
The following image shows how the calculation results may be affected if the grid is too coarse. A 10-cm-long prismatic lime silica brick specimen, sealed on the sides and one face, was saturated with water and then left to dry in a climate chamber. In a WUFI calculation, the liquid transport coefficients and the water vapour transfer coefficient were adjusted until good agreement with the measurements was reached. The diagram shows such a calculation using 20 equidistant grid elements (solid line) and another calculation with the same material data, but using only 5 grid elements.
Obviously, the latter grid is too coarse. Note however, that despite the remarkably small number of 5 grid elements, the results are not entirely inaccurate!
Note: the equidistant grids with 20 and 5 elements, respectively, have been used here for demonstration purposes only. A better choice would be an expanding grid with small elements close to the drying surface and larger elements close to the sealed surface.
How to choose a suitable time step
The temporal evolution of the building component, too, has to be discretised for the numerical treatment - the temperature and moisture fields are calculated for separate, discrete points of time only. The solution algorithm starts with the present fields and calculates from them the new fields for the next point in time which is one time step later.
The derivation of this algorithm leads to a time integral over the dependent variable (temperature or moisture) which has to be approximated by an expression that can be treated numerically. To this end it is necessary to know the behaviour of these variables as a function of time - but it's that unknown time-dependent behaviour because of which we are undertaking the calculation!
Therefore, assumptions have to be made about the unknown time-dependent behaviour. These choices determine the method to be used.
The simplest choice is the assumption that at each grid point the variable in question always has the same constant value during the time step it had at its beginning - and then 'suddenly' at the end of the time step jumps to the newly calculated value. Example: the heat flows between a grid point and its two next neighbours resulting from the present temperature field are determined. It is then assumed that these flows remain unchanged during the time step and from the resulting increase or decrease of heat the new temperature at the grid point is calculated. Since the calculation involves only the known temperatures of the two neighbouring points, it can be separately done for each and any grid point. This is the explicit scheme.
On the other hand, one may use those values for the variables during the entire time step which they will have at the end of the step. This does not require clairvoyance but the solution of a system of equations. The final temperature of the grid point in question depends on the heat flows which depend on the final temperatures of the neighbouring points which in turn depend on the final temperatures of their neighbouring points etc. etc. At both ends, this chain is terminated by the known boundary conditions, and the whole of this constitutes a system of equations: there exists a unique solution which can, however, only be found by solving the problem for all grid points simultaneously. This is the implicit scheme.
If during the time step the variables are set to the mean value beween their initial and final values (which corresponds to the time-average if the change is linear), the result is the widely used Crank-Nicolson scheme. In addition, there are a number of other schemes not discussed here.
The explicit scheme is the simplest one. However, its stability reqires that the width of the time step is below some upper limit which depends on the spatial discretisation. A high spatial resolution thus requires very small time steps which result in a very high, often not tolerable computation load.
The implicit scheme is somewhat more complex since an entire system of equations has to be solved for every time step. However, it has the advantage of being stable for all time step widths. The computation load is thus markedly reduced since much wider time steps can be used without numerical problems.
The Crank-Nicolson scheme is of higher order and therefore theoretically more precise than the other two schemes. In the case of non-linear transport coefficients, however, it is prone to numerical oscillations which might produce physically unrealistic results. Furthermore, for applications in building physics, where material data and boundary conditions often are only known with limited accuracy, lower-order methods are perfectly sufficient.
For these reasons, WUFI uses the implicit scheme (which is also called "fully implicit" in order to distinguish it from partially implicit schemes like Crank- Nicolson).
The implicit scheme also has the advantage that it is a physically more realistic approximation for wide time steps: the change of a variable exposed to constant boundary conditions often has an exponential character; with its larger variation at the beginning of the time step and smaller variation at its end, this behaviour is closer to the implicit scheme than to the linear variation in the case of Crank-Nicolson or even the constant behaviour in the case of the explicit scheme. If the time steps are small enough, however, any physical quantity varies more or less linearly - and is then better represented by Crank-Nicolson.
Example 1:
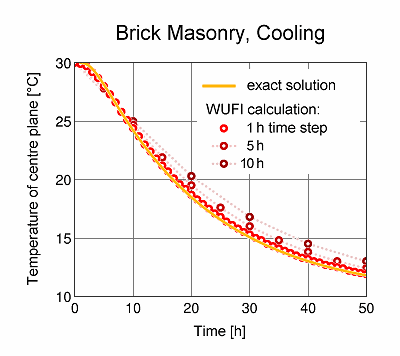
A 36.5-cm-thick brick wall, treated as homogeneous, initially has a temperature of 30°C. At time t=0, the ambient air temperature suddenly drops to 10°C.
The following table shows the temperature in the centre plane of the wall after 20 hours, calculated with 50 equidistant grid elements and time steps between 0.1 and 10 hours, compared to the exact solution:
exact: 18.5 °C
WUFI:
0.1 h: 18.5 °C
0.5 h: 18.6 °C
1 h: 18.7 °C
5 h: 19.5 °C
10 h: 20.3 °C
With very short time steps, the result is virtually exact; a time step of one hour still produces a very good result. With increasing time steps, however, the changes in temperature during the step are less and less well taken into account.
In the diagram, the exact course of the temperature in the centre plane is shown as a solid line, the calculation results with time steps of 1, 5 and 10 hours as dots.
Example 2:
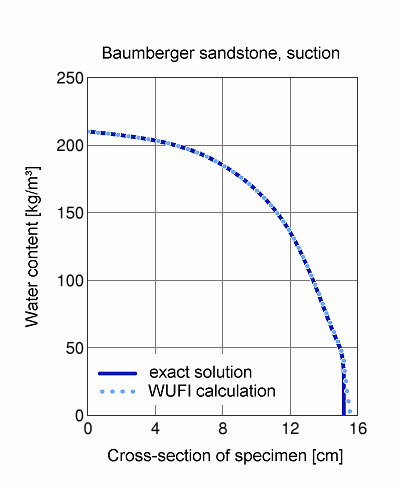
An imbibition experiment is performed with a prismatic specimen of Baumberger sandstone, sealed on the flanks and one face; the unsealed face of the specimen is completely wetted with water (by setting the 'rain' in the climate file to a very high value).
The numerical imbibition experiment is conducted over two time intervals and with various time steps, then the water absorption coefficient (A-value) is determined from the imbibed amount of water.
The grid contained 100 equidistant grid elements, distributed across 6 cm and 20 cm of the specimen length, respectively. Diffusion transport was not allowed for.
The numerically exact A-value for the liquid transport coefficients used here is 0.0426 kg/m²Ös (obtained by a method which is independent of any grid widths and time steps).
| time step [h] | A-value [kg/m²Ös] | |||
| after | ||||
| 10 h | 100 h | |||
| 0.5 | 0.0427 | 0.0428 | ||
| 1 | 0.0426 | 0.0428 | ||
| 2 | 0.0424 | 0.0428 | ||
| 5 | 0.0419 | 0.0427 | ||
| 10 | 0.0408 | 0.0426 | ||
| 20 | - | 0.0425 | ||
| 50 | - | 0.0419 | ||
| 100 | - | 0.0408 | ||
In this example, the result is only very weakly dependent on the choice of the time step.
Of course, the results are given to three significant digits for comparison purposes only - because of measurement uncertainties the A-value of the actual specimen from which the liquid transport coefficients were taken may slightly differ from these calculated results.
The two different calculation intervals also serve to illustrate the accumulation of numerical errors (see below).
The diagram shows the suction profile after 100 hours. The 'exact' solution is shown as a solid line, the WUFI calculation, as a dotted line. The agreement is nearly perfect; only in the lower part of the curves, it becomes evident that WUFI's finite grid resolution cannot represent arbitrarily steep moisture gradients.
There is also a non-numerical aspect to the choice of the time step. WUFI assumes that the boundary conditions read from the climate file are prevailing as constant values during the time step. For natural weather, this is only true as an approximation. Some thought should be given to the validity of this approximation.
For applications in building physics, it turns out that generally a time step of one hour is adequate. This is fortunate since measured weather data often are not available with higher temporal resolution than hourly mean values.
Shorter time steps should be required in special cases only. The adequacy of longer time steps has to be decided case by case. They must not be used if solar gains play a noticeable role.
The solar radiation shows a very pronounced diurnal variation. Because of the hygrothermal inertia of a building component, short-lived fluctuations in the radiation intensity - e.g. because of drifting clouds - have no major effect and may be 'smoothed away' in an average value. The systematic variation of the radiation intensity over several hours, however, cannot be damped by the inertia of the component and leads to corresponding variations in temperature. Because of the exponential dependence of the water vapour saturation pressure on the temperature even short-lived temperature peaks should not be averaged away - the evaporation resulting from a mean temperature is too low [1].
Similar arguments apply to rain: if the component can absorb even a moderate amount of moisture by capillary conduction, a sufficiently accurate duration of rain events in the climate data may be decisive for a realistic calculation of the moisture balance; the same amount of 'mean rain' distributed over 24h would probably yield completely meaningless simulation results.
In other cases - e.g. diffusion calculations in shaded building components sheltered from rain - use of daily or even monthly mean values may be adequate.
There is no point in using smaller time steps than the time interval over which the boundary conditions are assumed to be constant. For example, if you have hourly mean values of the weather data, a time step of one hour is sufficient - smaller time steps do not increase accuracy.
To be sure that a suitable time step was chosen for the calculation, you may repeat the same calculation with other time steps - the results should not change noticeably.
Accumulated and damped errors
A building component which is exposed to periodic boundary conditions approaches a "periodic steady" condition, i.e. a series of conditions repeating with the period of the boundary conditions. This periodic steady condition is independent of the initial condition of the building component - it has completely forgotten its earlier conditions.
This forgetfulness also applies to 'inaccurate' conditions: if during a calculation a temperature or moisture field has not been accurately calculated at one time step (e.g. because of a convergence failure), its effect on the subsequent time steps will wear off more and more until finally the calculation will proceed as if the error never had happened.
The natural weather is not strictly periodic, but in the long run it also leads to a 'typical' condition of the building component which also shows a certain forgetfulness.
Therefore, numerical inaccuracies do not necessarily always accumulate and render the result useless after a sufficiently long calculation. In fact, the longer the calculation is running, the less it suffers from earlier inaccuracies. This is simply a consequence of the natural physical behaviour of a building component.
Of course, this only applies if the inaccuracies do not occur systematically or regularly, and if the calculation interval is sufficiently long compared to the memory of the building component. A massive moist concrete wall will take years to dry out and to reach a periodic steady state - and since the process of drying is always proceeding in the same direction, the inaccuracies may also occur in the same direction and possibly accumulate nevertheless.
Example:
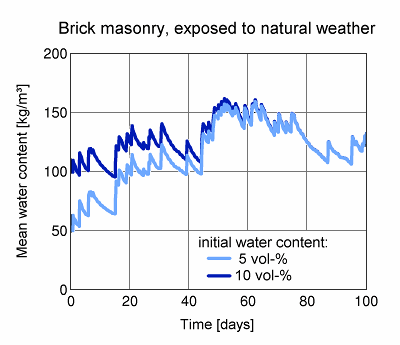
The diagram shows the course of the mean water content of a facade test element with unrendered brick masonry (24 cm thick) which has been exposed to Holzkirchen's copious driving rain. The solid line represents a WUFI calculation with an initial moisture content of 100 kg/m³ (10 vol-%), assumed constant across the wall. The dashed line shows another calculation with an initial moisture content of 50 kg/m³ (5 vol-%). The drier brick absorbs more water during a rain period, so that the mean water contents of the two specimens become indistinguishable after about 60 days.
Conclusion
The foregoing discussion was to show you that WUFI has a remarkable stability in its
calculations, but it nevertheless also has its limitations and, in addition, is
dependent on a certain insight of the user into specific numerical and
physical details.
Hopefully, it will help you to successfully apply WUFI in its proper scope.
Literature:
[1] Künzel, H.M.: Simultaneous Heat and Moisture Transport in Building Components.
One- and two-dimensional calculation using simple parameters. IRB Verlag 1995
[2] Holm, A., Krus, M., Künzel, H.M.: Feuchtetransport über Materialgrenzen im Mauerwerk. Bauinstandsetzen 2 (1996), H. 5, 375 - 396.
18 Aug 97, 11 Oct 00, 29 Mar 01 TS
