Passive:Verification: Unterschied zwischen den Versionen
SebSta (Diskussion | Beiträge) |
SebSta (Diskussion | Beiträge) |
||
| Zeile 31: | Zeile 31: | ||
== Climate == | == Climate == | ||
[[Bild:Passive-verification_climate.png|right|thumb]]<br style="clear:both" /> | [[Bild:Passive-verification_climate.png|right|thumb]] | ||
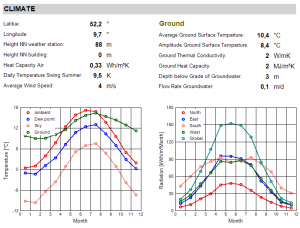
Gives a summary of the information given in the [[Passive2:Dialog_Climate|localization/elimate]] section of the tree and also calulations of not given values (e.g. ground temperature) and puts it together into a graph.<br> | |||
The second graph displays the solar radiation and its orientation.<br style="clear:both" /> | |||
== Calculation Parameters == | == Calculation Parameters == | ||
[[Bild:Passive-verification_calculation_parameters.png|right|thumb]]<br style="clear:both" /> | [[Bild:Passive-verification_calculation_parameters.png|right|thumb]]<br style="clear:both" /> | ||
Version vom 27. Juni 2013, 14:15 Uhr
Results of Passive House Verification
This page shows the different subpoint of the output of the Passive House Verification. To each subpoint there will be a short description of the output parameters as well as a screenshot.
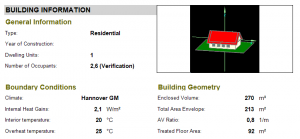
Building Information
The first section summarizes some general information about the building itself.
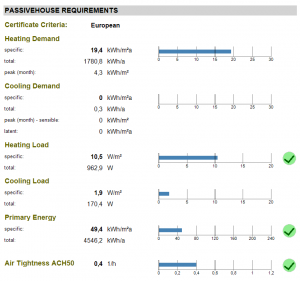
Passivehouse requirements
The primary passive house requirements depend mostly on needed energy, mostly in the form of cooling and heating as well as primary energy demand. All values are given in a specific value (per square meter/feet) and in total. Heating and cooling demand also provide a peak value(month).
Secondary Passivehouse Requirements
The scondary requirements consist of the HRV efficiency and a percentage chance of overheating of the building. Depending on the numbers WUFI®Passive will give recommendation if a seperate cooling system is needed or not.
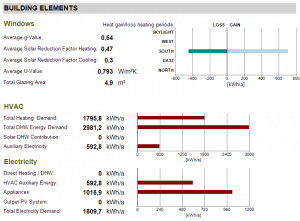
Building Elements
The building elements describes the influences of windows, HVAC systems and electric devices on the energy demand.
Windows
The graphic shows the heat losses and gains of solar radiation through windows depending on the orientation. Also average values over all windows are given together with the total glazing area.
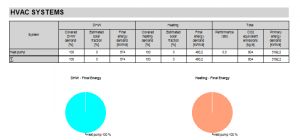
HVAC
The energy demand of all HVAC devices is listed here.
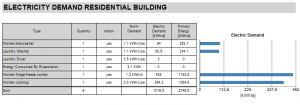
Electricity
The energy demand of all other electric devices is listed here.
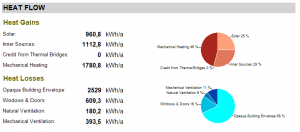
Heat Flow
Heat gains and losses are divided on different causes.
Heat gains are seperated into solar gains, inner sources, thermal bridges and mechanical heating.
Heat losses are seperated into windows&doors, the building envelope and natural and mechanical ventilation.
Both statistics are displayed in a pie chart.
Climate
Gives a summary of the information given in the localization/elimate section of the tree and also calulations of not given values (e.g. ground temperature) and puts it together into a graph.
The second graph displays the solar radiation and its orientation.
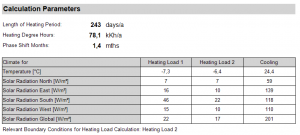
Calculation Parameters
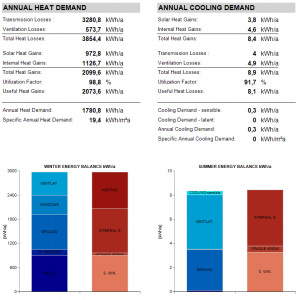
Annual Heat/Cooling Demand
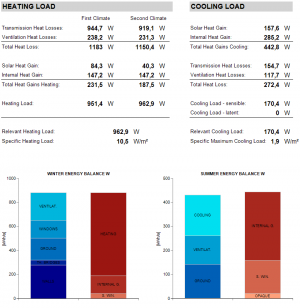
Heating/Cooling Load
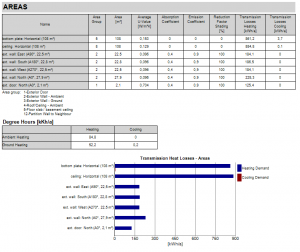
Areas
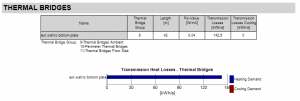
Thermal Brigdes
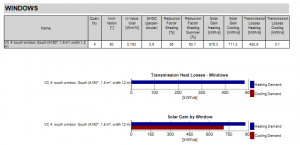
Windows
A new screenshot is needed here.
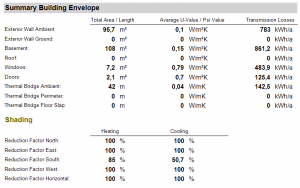
Summary Building Envelope
HVAC Systems
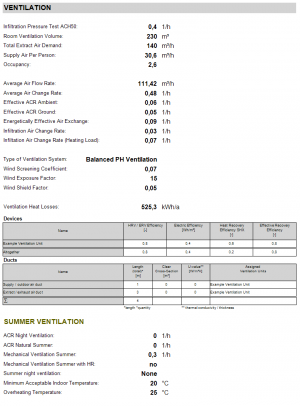
Ventilation
Electricity Demand - Auxiliary Electricity
Electricity Demand Residential Building
Internal Heat Gains
