Passive2:Dialog Climate: Unterschied zwischen den Versionen
SebSta (Diskussion | Beiträge) |
SebSta (Diskussion | Beiträge) |
||
| Zeile 11: | Zeile 11: | ||
== Climate == | == Climate == | ||
The climate tab summarizes temperature and radiation data in a table and a graph. The picture on the right can be used as a reference for the describtion. | |||
[[Bild:Passive-case1_climate.png|thumb|right|Climate]] | [[Bild:Passive-case1_climate.png|thumb|right|Climate]] | ||
=== Temperature === | === Temperature === | ||
The | The upper table shows the monthly mean ambient temperature and, if given in the climate file, the sky, ground and dew point temperature, though they are not necessary for the calculation. The extreme weather condition on the right end are needed to calculate the heating loaf of the building. | ||
=== Solar radiation === | === Solar radiation === | ||
The | The lower section contains the mean monthly solar irradiation, seperated into the four cardinal points and also the extreme weather conditions. | ||
== Primary energy/CO2-factor == | == Primary energy/CO2-factor == | ||
Version vom 23. Juli 2013, 13:13 Uhr
Unlike WUFI®Plus, WUFI®Passive does not hourly data for calculation.
Localization
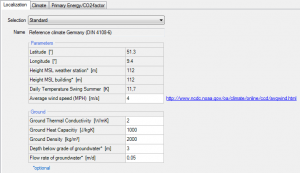
The climate file is chosen in the localization tab. WUFI's predefined climate is a reference year of germany and can be altered by using the "user defined" tab in the scope and by browsing the required climate file.
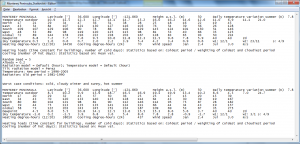
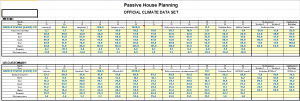
Due to WUFI®Passive not using hourly data, different climate files and formations are needed. So far WUFI can read .txt and .xls files as seen in the screens below and in this movie. To obtain these files/formation you can use meteonorm.
Climate
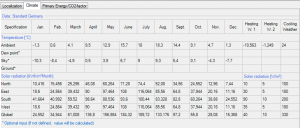
The climate tab summarizes temperature and radiation data in a table and a graph. The picture on the right can be used as a reference for the describtion.
Temperature
The upper table shows the monthly mean ambient temperature and, if given in the climate file, the sky, ground and dew point temperature, though they are not necessary for the calculation. The extreme weather condition on the right end are needed to calculate the heating loaf of the building.
Solar radiation
The lower section contains the mean monthly solar irradiation, seperated into the four cardinal points and also the extreme weather conditions.
Primary energy/CO2-factor
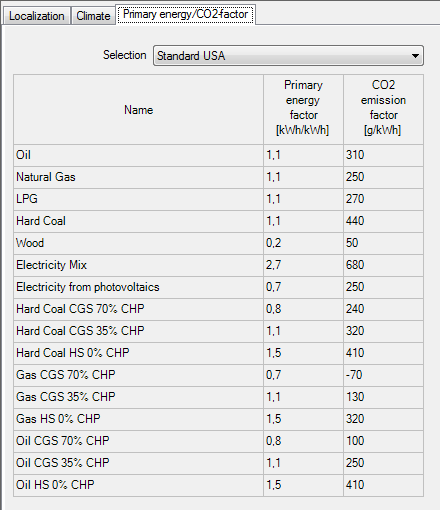
In this tab, you can see and set the primary energy factor (PEF) and the CO2-emission factor (CO2EF).
The PEF multiplies with the energy demand and varies depending on the chosen material, because the PEF is influenced by both the production process and the transportation of the energy source.
The CO2EF converts the energy demand into an equivalent amount of CO2. These two factors are important when looking into the sustainability of the passive house.

Though differences are minor, WUFI knows 3 different standarts regarding the values of this table. If you do have different ones, you can set your own table in the "user defined" section.
