Plus:Dialog Case: Unterschied zwischen den Versionen
Len (Diskussion | Beiträge) |
Len (Diskussion | Beiträge) |
||
| Zeile 61: | Zeile 61: | ||
[[Bild:WUFI-Plus_ASCII-Output.png]] | [[Bild:WUFI-Plus_ASCII-Output.png]] | ||
On this page it is possible to choose the results as ASCII-Files for an output into a <tt>*.txt-file</tt> or in a <*.xls.-file</tt>. | On this page it is possible to choose the results as ASCII-Files for an output into a <tt>*.txt-file</tt> or in a <tt>*.xls.-file</tt>. | ||
Version vom 27. Oktober 2008, 11:16 Uhr
Dialog: Case
A project file may contain several different cases. This is useful for managing projects which require a series of calculations that cover the same general subject but are slightly different from each other (e.g. parametric studies). In principle, all the cases in a project are independent, however.
A new case is created either with the
"New Case" command in the
"Project" menu or with the
"New Case" button ![]() in the tool bar.
in the tool bar.
General
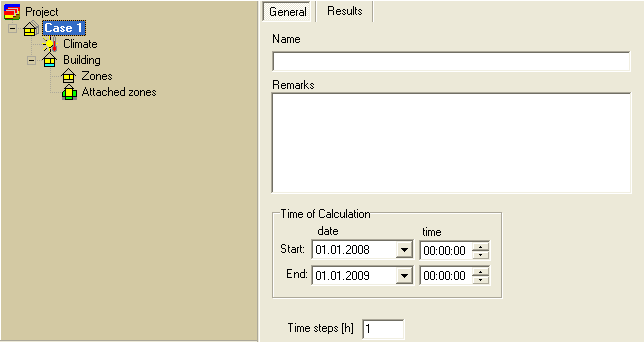
In this dialog, you can assign a "Case Name" to the current case which is easier to identify that case and the differences between the cases of one project. You can also enter additional information, such as any "Remarks" on the case. All these inputs are optional. They have just an informative character and can help you later to identify the studied problem. The most important option on this page is to define the time of calculation of the case inclusive the time steps.
You may create an arbitrary number of cases in a project, but since all the calculation results are saved in the same project file together with the input data (unless this option is deselected), the project file may become unmanageably large when it contains many cases.
Version notice: WUFI Plus allows an arbitrary number of cases.
Results
In this dialog you can see all results of the calculation of one case. Here are three options availible to show the results of the case.
1) Data&Results
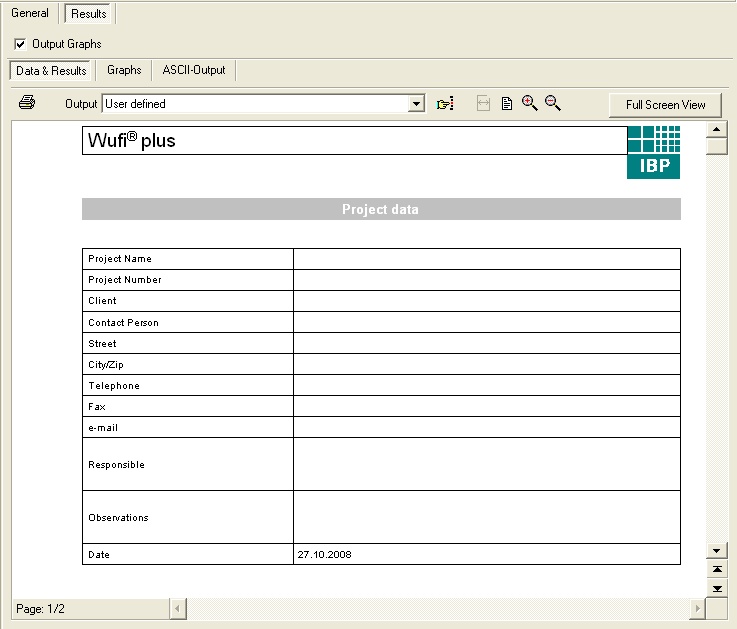
This page shows the report about the calculation. You can see the information of the project the climate conditions, general Data about the building and all data which insert into the case.
2) Graphs
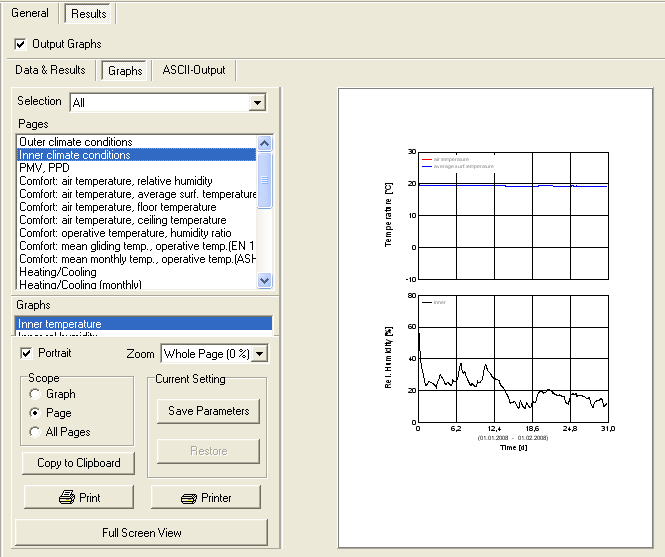
This dialog shows all graphs of the outer/inner climate conditions, the comfort conditions inside the heated zone and of the energy consumption of the heating/cooling system and the flows of moisture, air and heat. The design of the graphs can modify by the user and it is possible to print the graphs directly.
3) ASCII-Output
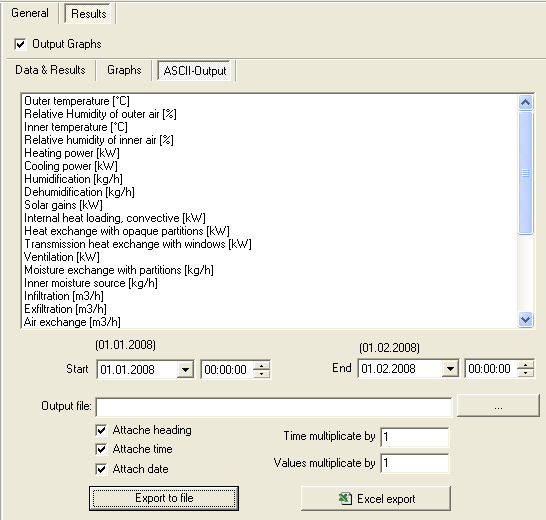
On this page it is possible to choose the results as ASCII-Files for an output into a *.txt-file or in a *.xls.-file.


