Once you have supplied WUFI plus with the needed data it can calculate the temporal evolution of the temperature and moisture fields in the building components and the inner climate conditions.
There are general results for the whole building and results for each individual component.
Results for the whole building can be found under the respective case entry in the Navigation Tree after the calculation under Report: Data & Results.
There are three subsections:
Report: Data & Results
A couple of operations are possible in the Results Tab, see the picture above for the different buttons.
Expand/Shrink Window: Before working with the results you might want to expand the results window to full screen size.
Page Setup: The Page Setting/Preferences Window opens and paper size, top and side margins can be altered. Else under preferences you can decide whether you want to start new topics on new pages and whether or not you want to allow breaking of tables (the Page Setup button only works if View is changed to print setup)
Scope/Sequence: See scope user defined to learn more about this button
Options: Colors of the illustration can be changed using the Options button
Whole Width: Clicking this button the whole width of the window is used to display the results
Whole Page: Clicking this button the whole page you are looking at is displayed
Zoom in and out: to enlarge or lessen the size of the illustration
Print all: Has the whole selected scope printed by your default printer. (This button only works if View is changed to print setup)
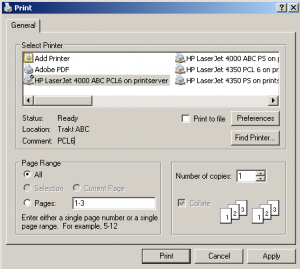
Print dialog: Click here to open the print dialog. Select a printer, for changing the printer options click the "Preferences" Button, "Find printer..." opens a dialog that helps you find a suitable printer that is able to meet the requirements. Also the page range and the number of copies can be altered. (The button only works if View is changed to print setup)Print Dialog
Export in Word: This Button is not implemented yet.
Help: This Button is not implemented yet.
There are different scopes with different contents to choose under Data&Results:
Project data: The general information about the project that can be entered under the Project entry in the Navigation Tree
Climate: Some basic information about the outer climate you chose under Climate
Conditioned zones: Overview on important information you entered for the zones (geometry, other parameter, accuracy...) and the components (geometry, surface, numerics...) belonging to those.
Assemblies: Overview on the assemblies used in the project. All important values on different layers and the whole assembly are displayed
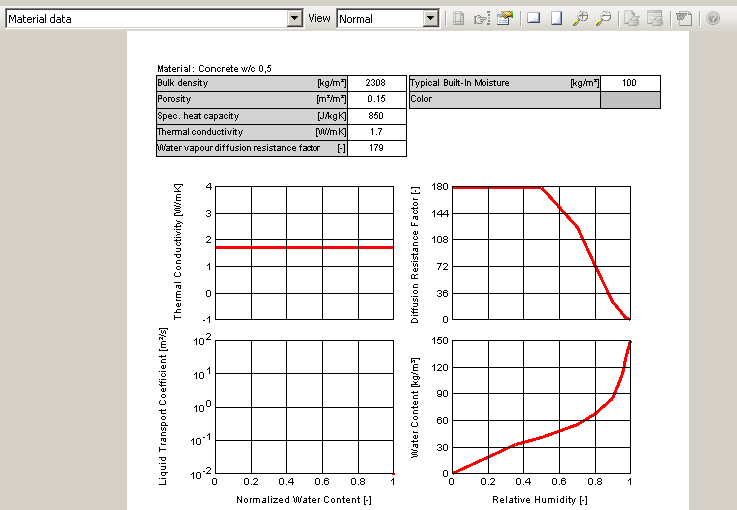
Material data: More detailed values and graphs on the materials used in the project
These first five entries can be viewed before the calculation, too, as they are just a illustration of data entered by the user.
Results: A overview on the results for the different zones and components containing
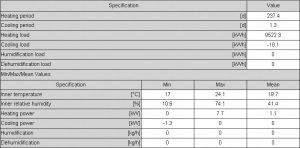
main results for each zoneResults for one Zone
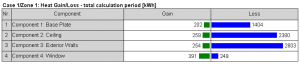
the total heat gain and loss for each zone (during the heating period, the cooling period and during the whole calculation period) Heat gains and losses for the calculation period
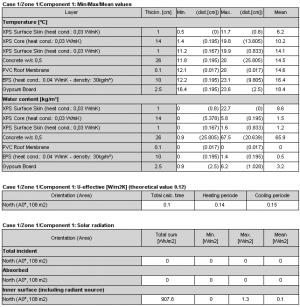
Min/Max/Mean values, U-effective, values for solar radiation for each opaque component Results for one component
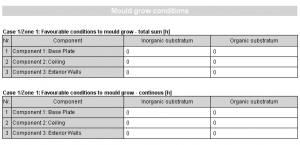
Mould grow conditions: the total sum [h] and the continous hours of favourable conditions to mould growth for the components of each zone mould grow conditions
User defined: A user defined composition of information can be generated. Click the Scope/Sequence button to open the Scope/Sequence window. There you can decide which parts of the results you want to include into your user defined assembly. Elements on the left are chosen elements, therefore are part of the user defined assembly, scopes on the right side are available but not chosen. To switch elements just move them using drag and drop. As well with the "Select all" button, all elements can be moved to the respective side. Click "OK" when your selection is finished.
Graphs
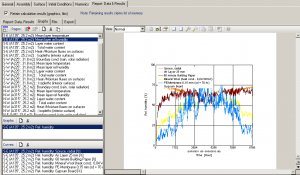
There are three blocks on top of each other on the left side, the uppermost is the pages block where a list of all pages that were created by WUFI after the calculation is shown. The Z and the number in front of the pages stand for the respective zone (Z.1 = Zone 1). The second block is the graphs block where all graphs belonging to the page you selected above are displayed and the third is the curves block, where all curves belonging to the graphs are listed.
The Buttons
The Graphs tab offers a lot of opportunities, too. For the buttons see the picture above.
Expand/Shrink window: You can Expand and Shrink the Graphs window with this button.
Selection: You can choose which selection of graphs you want to have displayed, all graphs, or those either concerning Climate, Comfort, Energy or Humidity.
Retain current settings: to remember changes on Graphs (Axis texts, labels etc.) made by user to current graphs
Restore retained settings restores remembered settings after a new calculation is made and new graphs have been generated. This operation is for obvious reasons not always possible (e.g. if the restored graph isn't available in new calculation anymore).
Delete: This button appears in all three blocks. Clicking it deletes the selected page/graph/curve in the respective block.
Copy to Clipboard: Copies the selected page to the clipboard and consequently allows pasting of the corresponding graphs and curves.
Page Setup: The Page Setting/Preferences Window opens and paper size, top and side margins can be altered. Else under preferences you can decide whether you want to start new topics on new pages and whether or not you want to allow breaking of tables (the Page Setup button only works if View is changed to print setup)
Whole Width: Clicking this button the whole width of the window is used to display the results
Whole Page: Clicking this button the whole page you are looking at is displayed
Zoom in and out: to enlarge or lessen the size of the illustration
Print all: Has the whole selected page printed by your default printer. (This button only works if View is changed to print setup)
Print dialog: Click here to open the print dialog. Select a printer, for changing the printer options click the "Preferences" Button, "Find printer..." opens a dialog that helps you find a suitable printer that is able to meet the requirements. Also the page range and the number of copies can be altered. (The button only works if View is changed to print setup)Print Dialog
Export in Word: This Button is not implemented yet.
Help: This Button is not implemented yet.
Creating and modifying graphs
Remember there are three blocks, the pages block, the graphs block and the curves block.
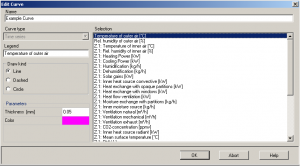
Creation of a new page: There is the possibility to create a user-defined composition of graphs of course. Use the Buttons in the orange boxes (see picture above) for this purpose.Click the "New page" button in the pages block. Next name the page in the in the window that pops up. To add graphs to that page make sure the newly created page is selected in the pages block before clicking the "New graph" button in the graphs block (Of course any number of graphs can be added to one page). Name the graph as well. To add curves to a graph select it and click the "New curve" button in the curves block. The "Edit curve" window opens up. Select a curve from the list and name it(if no name is entered the selected curve retains its name). The Curve type is always "Time series" as all graphs show the course of different values over the calculation period. You can either keep the proposed legend or alter it as required. Choose an adequate draw kind and adjust thickness of the curve and its color. More curves can be added to the graph proceeding the same way. Note that after selecting the first curve the choice of curves is limited in the "Edit curve" window as further curves need to have the same entity as the one selected first in order to fit into the same graph. To change the information you made about a page, graph or curve just double-click onto it in the list. If the curves can't or only parts of them can be seen in the graphs you might need to edit the diagram. (see below)
Adding graphs and curves to already existing pages and adding curves to already existing graphs is also possible. Just follow the description above.
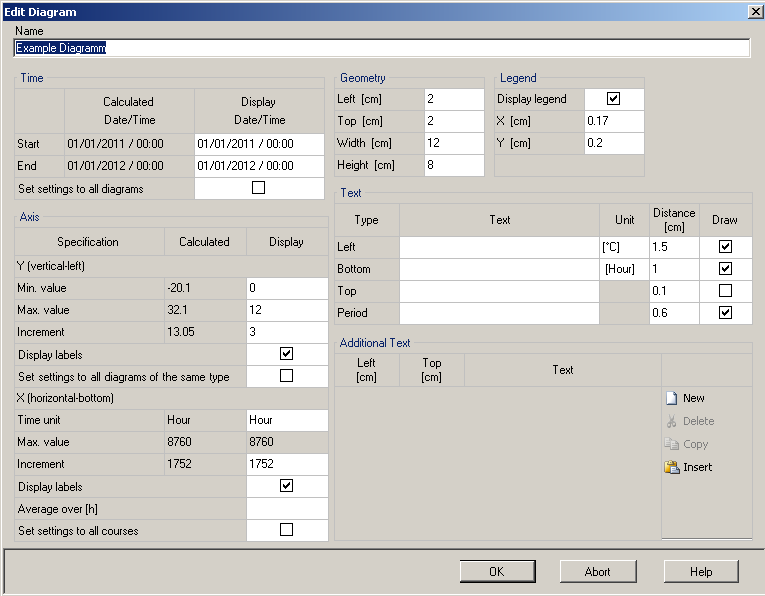
Editing a diagram: Double-click onto the visualization of the diagram on the right side to make the "Edit Diagram" window pop up.Edit Diagram Window
Time: In the left column calculated time period is shown, in the right column the period for the diagram. By clicking into the entry, values can be changed manually as well as with a calendar that can be opened by clicking onto the button on the right side. (This button only appears after clicking into the entry.) If "Set settings to all diagrams" is check-marked, all diagrams only visualize the supplied time period.
Axis: Specifications for x and y axis like Minimum, Maximum value, Increment of the graph can be made here. Again the right column shows the calculated values and the right column allows inputting of user-defined values. (Example: If the calculated minimum value for temperature is 20°C it might be unwise to input 0°C as Minimum for the y Axis.) The x axis is the time axis.
Geometry: Width and height of the diagram can be altered as well as indention of the diagram from paper margin on the left and on the top.
Legend: It can be decided whether the legend should be shown and its size can be modified.
Text: A text for left side, bottom side, top side and period can be entered, units for numerical labels of the axises can be adjusted distances from the diagram can be modified and it can be decided whether the text should be drawn (=shown) in the diagram.
Additional Text: Additional Text can be added to the diagram by clicking the "New" Button. The distance (left, top) from the upper left corner of the diagram and a text need to be inputted.
Movie
Watch this MOVIE to see how an individual page is created and modified. The movie was made for Example Case 2. Look at it for backgrounds.
Export
Another possibility to work with results is the export of the needed results as ASCII to Excel or a file.
All calculated curves
Select results you want to export in the list of available results (for example by using Strg and your mouse). Next a time period can be chosen for which values should be exported. the right column shows start and end of the calculation period, in the right column values for the period to be exported can be entered. By clicking into the entry, values can be changed manually as well as with a calendar that can be opened by clicking onto the button on the right side. (This button only appears after clicking into the entry.) If no changes are made to the period, results for the whole calculation period are exported. Click the "Actualize Min/Max/Mean" button to see the Minimum, Maximum and Mean Values for each course in your list for your inputted export period. Under Parameters several more details can be altered. You can decide whether you want to attach a heading to your export file (see export file below for a example heading). Of no heading is attached values start in the first line in the export file and there isn't even a label for the columns. Next decide whether date and time should be attached. If so,date and respective time of day are the first column of your export file. Also time can be attached ascending, this means hours are added (from 1 to 8760 for one year, for example). Enter a factor for time and value multiply, if you want to. If time multiply is changed from 1 to another value the ascending hours are multiplied with this factor. If the value multiply factor is altered all resulting values are multiplied with it. You can either export to text file or to a excel file. For exporting to text files either enter path into the export file name field or open the save as window by clicking onto the button on its right. After that, click onto the "Export to file" button to generate the export file. For exporting the selected curves to an excel file, just click the "Excel export" button and an excel table opens up.
Example text file:
Graph curves
See the all calculated curves chapter above for further information on exporting results to files.
Movie
This MOVIE shows how to export to a .txt file and how to make an excel export. It is taken from Example Case 2 that can be found in the tutorial section.
Heated Zones
The results Section for the individual zones is very similar to that of the whole case. Logically the results and graphs sections for one zone only contains results and graphs concerning this special zone whereas the whole composition of all results can be found in the cases' results section.
Export of data however is only possible in the case section.
For more information on how to work with results and graphs see the cases' results chapter.
Individual Components
Before the calculation "retain calculation results" can either be check marked or not for every component. If it is chosen, all films and graphics are saved for the respective component. However note that this claims lots of memory.
Opaque components
No retaining of calculation results
If the box wasn't check marked, you can find the following scopes under Results
Input data: contains general data concerning the component and information on the assembly. Input data can already be found in the results before the calculation, of course
Material data:Contains information on the materials used in this component with values and graphs
Results:Min/Max/Mean values, U-effective, values for solar radiation for each opaque component. Results for the Component
There is also a user defined scope. For explanation on how to create a user defined results scope and for explanation on the buttons see the cases' results chapter.
Retaining of calculation results
If the "retain calculation results" box was check-marked results like described above in "no retaining of calculation results" plus three additional subsections can be found after the calculation:
Graphs: Graphs concerning the component can be found here. To distinguish between graphs for different components the orientation, the azimuth and the area of the component is listed in the name of each graph (for example: S-E(A135°, 25.2m2)).On further information on how to work with graphs and buttons see the cases' results chapter. Graphs
Films: The films that show temperature and relative humidity inside the component and that can be watched during the calculation (if "show results" is chosen) are retained as well. If several components are grouped together the requested one can be selected under "Item to display".
: Back and Forward button. Makes the film run back and forward. To stop it click the Stop button . Watch the clock and date on the right side for temporal orientation. :Back 1 step and Forward on step button. Clicking these buttons makes the film jump one hour back or forward.
: Scroll to start and Scroll to end button allow jumping to start and end of calculation period.
This MOVIE shows what results you get for a component with and without checking "retain calculation results". The movie can also be found in Example Case 2 where its background is explained.
Windows
No retaining of calculation results
If "retain calculation results wasn't check-marked all that is retained for a window is a composition of general data.
Results for a Window
Retaining of calculation results
If the "retain calculation results" box was check-marked results like described above in "no retaining of calculation results" plus two additional subsections can be found after the calculation:
Graphs: A graph for the overhang shading factor is created. For more information in working with graphs see the cases' results chapter.


 in the pages block. Next name the page in the in the window that pops up. To add graphs to that page make sure the newly created page is selected in the pages block before clicking the "New graph"