1D:Dialog InsertCurves
Dialog: Insert Curves
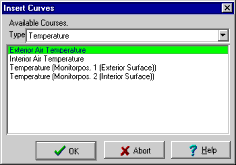
This dialog serves to select curves which are to be added to the graph whose name is highlighted in the "Graphs" list.
Each graph can only contain curves of the same type, i.e. only temperatures
or water contents etc. Otherwise, the axis labeling would require much more
elaborate editing features than WUFI can offer in the dialogs for the graph
settings (for
courses or
profiles).
If you need to have curves of different types in the same graph, you can
export the calculation results to an
ASCII file and use other software to create graphics.
If the graph contains no curves (either because you
deleted them or because you created a
new graph), then you can select the
desired "Type" of the graph by selecting it from the drop-down
list. WUFI then displays the available curves of this type in the curves list.
Select as many as you wish for inclusion in the graph.
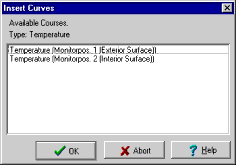
If the graph already contains curves, its type is fixed and WUFI only displays the available curves of the same type which are not yet in the graph. Select as many as you wish for inclusion in the graph.
Version notice: the editor functions are available in WUFI Pro only.
The following curve types and curves are available:
- Temperature:
the air temperatures on both sides of the component and the temperatures at the monitoring positions, in °C.
- Relative Humidity:
the relative humidities of the air on both sides of the component and the relative humidities at the
monitoring positions, in %.
- Volume-related Water Content:
the water content of the individual material layers of the component (different layers which contain the same material are represented by different curves), in kg/m³.
- Heat Flux:
the heat flux densities through both surfaces of the component and between the component layers, in W/m².
- Rain:
the driving rain load incident on the component surface, as dependent on the inclination and orientation of the component (and not yet multiplied by the rain reduction factor), in Ltr/m²h.
- Radiation:
- Solar Radiation (Exterior Climate):
the solar radiation incident on the component surface, as dependent on the inclination and orientation of the component (and not yet multiplied by the short-wave radiation absorptivity), in W/m². - Direct Solar Radiation (Exterior Climate):
the direct portion of the solar radiation (coming straight from the sun) incident on the component surface, as dependent on the inclination and orientation of the component (and not yet multiplied by the short-wave radiation absorptivity), in W/m². - Diffuse Solar Radiation (Exterior Climate):
the diffuse portion of the solar radiation (scattered towards the sensor by the atmosphere and by clouds) incident on the component surface, as dependent on the inclination and orientation of the component (and not yet multiplied by the short-wave radiation absorptivity), in W/m². - Reflected Solar Radiation (Exterior Climate):
the portion of the global solar radiation reflected by the ground and incident on the component surface, as dependent on the inclination of the component (and not yet multiplied by the short-wave radiation absorptivity), in W/m². - Counterradiation (Exterior Climate):
the sum of terrestrial and atmospheric counterradiation incident on the component surface, as dependent on the inclination of the component (and not yet multiplied by the long-wave radiation emissivity which determines the absorbed fraction of the incident radiation), in W/m². - Atmospheric Counterradiation (Exterior Climate):
the atmospheric counterradiation incident on the component surface, as dependent on the inclination of the component (and not yet multiplied by the long-wave radiation emissivity which determines the absorbed fraction of the incident radiation), in W/m². - Ground Counterradiation (Exterior Climate):
the terrestrial counterradiation incident on the component surface, as dependent on the inclination of the component (and not yet multiplied by the long-wave radiation emissivity which determines the absorbed fraction of the incident radiation), in W/m². - Reflected Atmospheric Counterradiation (Exterior Climate):
the portion of the atmospheric counterradiation reflected by the ground and incident on the component surface, as dependent on the inclination of the component (and not yet multiplied by the long-wave radiation emissivity which determines the absorbed fraction of the incident radiation), in W/m². - Long-wave Emission of Component:
the thermal radiation emitted by the component surface, in W/m².
- Solar Radiation (Exterior Climate):
- Area-related Water Content:
the water content in the entire component, in kg/m²
- Heat Transfer Coefficient:
The variation in time of the heat transfer coefficients at both surfaces (they are not constant if specified as wind-dependent), in W/m²K.
- Vapor Transfer Coefficient:
The variation in time of the water vapor transfer coefficients at both surfaces (they are not constant if the heat transfer coefficients are specified as wind-dependent), in kg/m²sPa.
- Moisture Flux:
The moisture flux densities through the two surfaces of the component and between its individual layers. In each case one curve for the capillary (i.e. liquid) flux, one for the diffusion (i.e. vapor) flux and one for the sum of both, in kg/m²s.
- Heat Source:
The variation in time of the source strength of the user-defined heat sources within the component (if any), in W/m².
- Moisture Source:
The variation in time of the source strength of the user-defined moisture sources within the component (if any), in kg/m²s.
- Pressure:
The barometric pressure of the ambient air and the water vapor partial pressures at the monitoring positions, in hPa.
If you have specified external measured data for inclusion in the result graphs, the corresponding curves are also offered for selection.

